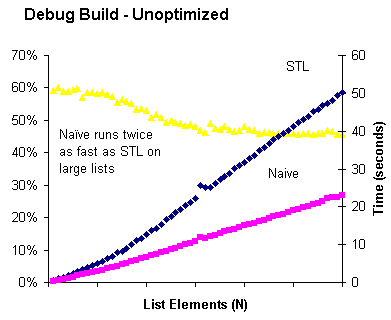
Here is a comparison between the naive lower bound and STL’s version. Execution time reported in seconds was measured using the Windows high resolution timer. An STL list of integers 1-N was created by populating a vector, shuffling it, pushing the elements onto a list, and sorting the list. This was done so the list elements would not be allocated sequentially and thus benefit from cache locality.
For each N, 200 evenly spaced numbers in the range 1..N were selected. To these were added 0 and N+1, so that boundary conditions would be tested. The test values were shuffled to disrupt cache effects. A preliminary test was done to ensure that both algorithms got the same results for all test values. Then the lower_bound operation was timed, for each test value, repeated ten times.
As expected, the cost of memory access dominates the cost of the comparison, so the STL algorithm’s guarantee of fewer comparisons (at the cost of a guaranteed 2N memory accesses) turns out to be a bad trade. Note the knee in the graph, seen most clearly in the relative times (yellow triangles). I believe what happens there is the entire data set no longer fits in cache, and the STL algorithm suffers disproportionately from this because its first step — calculating the length of the list — causes the first elements to spill from cache as the last elements are being traversed. Then when it goes back to the beginning and starts its binary search, the first elements need to be reloaded from cache.
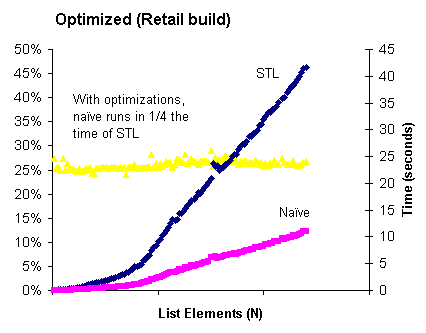
The results for a build with optimization turned on are similar:
In this case the Naive algorithm is consistently 4 times faster than STL, and you can clearly see the knee in the STL graph around the first tick mark — effectively there are two linear portions of the graph. Interestingly, both STL and Naive suffer similarly from cache effects, as the relative timings stay constant as we pass the knee and get to the cache-limited region. Also (though you can’t see it because I left off the values of N), the numeric value of N where the knee occurs is larger in the optimized version (45,000 vs. 20,000), probably reflecting the overhead that the debug memory allocator attaches to each block.


One Trackback/Pingback
[…] problem, in a word: caching. Next time: data! Posted by Sam_old on Friday, June 27, 2008, at 12:32 pm. Filed under Uncategorized. Tagged […]
Post a Comment